


There will be more pedestrian activity closest to the main school building.
Method:
Synchronised 5 min pedestrian count at 9.40am at varying distances from school.
Pragmatically sampled at locations known to be on the tour path.
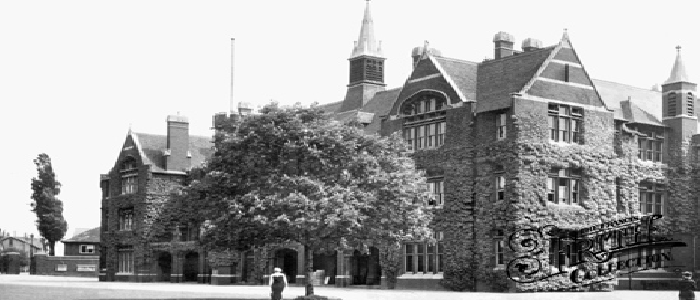
Graphical Evidence of what location looks like.
Results:
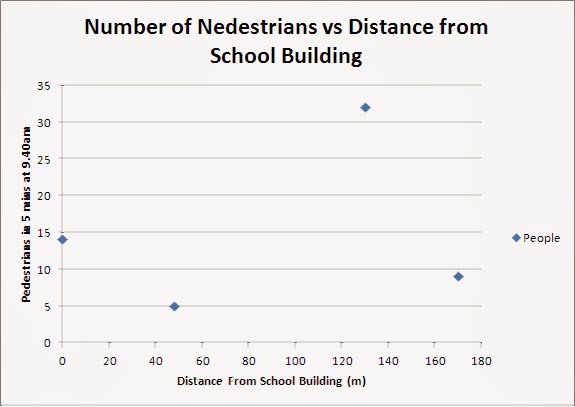
Scatter Graph of Pedestrians vs Distance
Interactive Map of Results (click on Green Pins for Results)
View Larger Map
Analysis
There is no clear correlation of results. The centre of school was only the second highest result. However, being near the car park means we could remove the top result as an anomaly. It is more than twice the size of the next largest result. If this was removed, the centre of school would be the highest result, but from a set of 3 points.
Therefore, we cannot support our hypothesis with this data. If we include the car park result, then we can actually disprove it.
Evaluation
We only took a 5 minute period early on the Open day, at only 4 locations. This did not allow us an even spread of the school site and removes the temporal factor that may see pockets of people ebb and flow at sites during a day.


No comments:
Post a Comment